Friday, February 24, 2017

Multi-band Dipole -- ladder line 96 ft vs 91 ft

Following another suggestion for tweaking my dipole, I added 5 ft to the 91 ft 450-ohm ladder line and used my antenna analyzer to compare the results with what I obtained previously. The two graphs below compare what the auto-tuner was able to achieve on selected frequencies on the 80 m and 40 m bands. SWR readings are what my transceiver reported after the tuner had reached its best match. Click on each image for the full size view.
The 80 m band view shows that the longer ladder line feed results in lower SWR on the frequencies below 3.9 MHz.


The 40 m band view shows mixed results, but all readings are below SWR = 2.0.

The next two graphs compare the impedance magnitude vs frequency for the same two feed line cases on the 80 m and 40 m bands.


The 80 m band view shows that the impedance curve is shifted lower in frequency for the longer feed line.


The 40 m band view shows lower impedance at each frequency for the longer feed line.

I'm reviewing the SWR data measured by the analyzer for these same cases. The numbers become erratic at SWR above 10. Below is the graph for the 80 m band. For the 40 m band, all data points are above SWR = 38 and are erratic. These values are probably beyond the valid range for the analyzer hardware.


Sunday, February 19, 2017

Multi-band Dipole - version 2

This posting continues my exploration of the performance of my multi-band dipole as reported earlier. Based on suggestions from KE4ID, I revised my antenna to the following specs:
  • 102 ft total length of horizontal portion (previously 110 ft)
  • 91 ft of 450-ohm ladder line (previously 84 ft)
  • DX Engineering 1:1 balun (also tested with LDG 1:1 balun on 80 m band)
  • 12 ft of 50-ohm coax to the antenna tuner
Update: Ultimately, I may need to change the feed line to 300-ohm ladder line. The current configuration is an attempt to reuse the 450-ohm line that fed my original 80 m loop at this location. Due to the loss of one of my corner support trees, I reconfigured the antenna materials to a dipole. The recommended feed line for a multi-band shortened dipole, used with a tuner, is 300-ohm ladder line.

The graph below shows the SWR vs frequency as measured with my antenna analyzer across the range of 3 to 30 MHz. The wide variation of SWR is an indication of the complexity of the overall antenna system. Also shown (as discrete points) are SWR data for selected frequencies on the transceiver side of the antenna tuner. These points show that the tuner is able to present reasonable SWR to the transceiver on most of the frequencies I sampled. An area of challenge is the 3.5 to 4 MHz band. The next graph shows this frequency range more closely.

SWR - 3 to 30 MHz
The graph below shows the frequency range of 3.5 to 4 MHz. Along with the same SWR data measured by the analyzer there are two sets of SWR points from the transceiver side of the antenna tuner. Testing with the LDG 1:1 balun provided better results than the DX Engineering 1:1 balun at the lower end of the frequency band. Similar high SWR results at the low end of the band were also obtained with the previous configuration of the antenna and feed line. 

SWR - 3.5 to 4 MHz
The power efficiency of this antenna system (as built) is unknown. Instrumentation on the antenna side of the balun might reveal how much power or current is outbound to the antenna, and how this design compares with resonant antenna designs.

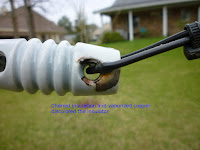
While adjusting the overall length of the antenna from 110 ft to 102 ft, I had the opportunity to notice lightning-caused damage from last summer's event reported here. The two photos below show the effects at the western end of the antenna. Click on each image for the full size view.


Friday, February 17, 2017

Multi-band Dipole SWR on 75 m

As part of my continuing effort to get acceptable performance of the W8JI-style multi-band dipole (described in this article), I'm working with the original suggested 110 ft dipole length to cover 80 - 10 m. My current feed line has:
  • 84 ft of 450-ohm ladder line
  • a 1:1 choke balun
  • 12 ft of 50-ohm coax cable to the tuner (I may shorten this)
When operating on 3.74 MHz, I find that the antenna tuner is not able to do better than 2.6:1. The goal of the antenna is to present an impedance to the tuner on most frequencies that is manageable.

Focusing on 3.5 to 4.0 MHz, I collected SWR data with an antenna analyzer. I also used my transceiver at low power to evaluate what the antenna tuner could do. The plot below shows the analyzer SWR data plotted along with the tuner's best effort (at a few frequencies) at matching to 50 ohms for the transceiver. (Click on the image for a full-size view.)


Although the design guidelines are intended to avoid resonance within the lowest band (80 m in this case), the degree of mismatch within most of the operating range is not acceptable. I plan to lengthen the dipole elements by several feet to see if better results can be obtained below 4 MHz without sacrificing reasonable operation on higher bands.

- John

Monday, February 13, 2017

Multi-band Dipole Impedance and SWR

Related to my earlier posting, here are some plots of impedance magnitude and SWR for some variations of the W8JI-style multi-band dipole with balanced line feeder. All cases use a height above ground of 60 ft.

The first two plots below show SWR and impedance magnitude vs frequency for:
  • 220 ft dipole with 220 ft 450-ohm feed
  • 220 ft dipole with 186 ft 450-ohm feed
The color legend at the top right identifies the two curves. Click on the image for a larger view. The SWR data are computed using a 450-ohm source, matching the balanced transmission line impedance. An antenna tuner is used by the operator to match the transmitter's 50-ohm output. The antenna analysis software can be set to use a 50-ohm source (or any impedance for SWR calculation) or can be told to calculate the required (L & C) matching components at each frequency, if desired.

SWR - 220 ft Dipole at 450 ohms


Impedance - 220 ft Dipole


The next two plots are for:
  • 202 ft dipole with 60 ft 300-ohm feed
  • 220 ft dipole with 60 ft 300-ohm feed
In these cases the balanced transmission line has 300 ohm characteristic impedance. SWR data are calculated for a 300-ohm source.
SWR - 202 & 220 ft Dipoles


Impedance - 202 & 220 ft Dipoles


Both plots show the peaks and valleys at higher frequencies for the shorter antenna.

As always, these models cannot predict the exact conditions that will be seen at a typical ham residential installation of HF antennas, due to nearby buildings, trees, fences, etc. not included in the model. A commercial antenna installation with lots of clear area around the antenna (e.g. AM broadcast stations) will have much closer agreement between model and real world. The NEC software has been used extensively for many decades in designing commercial and military antennas, and is applicable to many ham radio antenna designs.

The simple models are capable of indicating the general behavior of a given antenna's shape, dimensions, height, feeder length and impedance. The models also predict the effects of changing a given antenna's parameters. The "cut and try" method is always important to achieving the optimal performance at a given site.

- John


Saturday, February 11, 2017

Comparing W8JI dipole to OCF dipole

Here are some analysis results for two forms of an HF multi-band dipole antenna for 160 m and up. The 220 ft W8JI multi-band dipole is based on the design guidelines presented in this reference on page 7. The off center fed (OCF) dipole analyzed here is based on a commercial product with total length of 270 ft, with one leg of 180 ft and the other of 90 ft. Both antennas are modeled at a height of 60 ft above ground.

This first phase explores the radiation pattern gain in dB compared to an isotropic antenna (dBi). Below are tables that give three calculated gain figures at one selected frequency on 10 different bands. The gain figures are the maximum values that occur for specific azimuth and elevation angles. The maximum horizontal gain and vertical gain do not occur at the same azimuth and elevation angles. For these horizontal antennas the maximum horizontal gain equals or exceeds the vertical gain for all cases.


The screen shots below show the calculated 2D radiation patterns in the horizontal plane for the azimuth and elevation angles that yield maximum total gain. The color key at the bottom left of each plot identifies the graph of total gain, horizontal gain and vertical gain. Click on each image for a larger view. For all plots the antenna structure is oriented from left to right. The OCF dipole has its longer element to the left.

160m W8JI

160 m OCF


80 m W8JI


80 m OCF


40 m W8JI


40 m OCF


20 m W8JI


20 m OCF


10 m W8JI


10 m OCF
While there are some differences in the radiation patterns and gains of the two designs for some of the frequencies analyzed, it is not apparent that one design has great advantage over the other with respect to these characteristics alone.

The bandwidth of each antenna design on each amateur band can be evaluated, to compare the performance across each band. The OCF dipole is intended to achieve a relatively low SWR across a good portion of each band without the aid of an antenna tuner. The W8JI dipole requires a tuner since it is designed to provide an impedance on each band that is in a manageable range for the antenna tuner.

The resulting power efficiency of each approach can be evaluated with some additional effort. Certainly the impedance and SWR profile for each design will be different. Neither design is likely to provide stellar performance across all 10 amateur bands. Each design has design / construction choices that may help to satisfy the operator across frequency ranges of the most interest.

- WA5MLF