Monday, March 13, 2017
Map of QSO participants
I updated a pair of Google Earth map views to show the locations of participants in our morning round table QSOs on 75 m. These are extensions of the earlier maps I made a few years ago of participants in the Saturday Bell Ringers Net. Click on either graphic below for a full-size view. The place marker dot, not the call sign label, represents the location of each station.
The view above shows frequent and infrequent participants. Four range circles, centered on W4BXI, are labeled with each radius in miles.
This second view is zoomed in to better display the stations within 100 miles of W4BXI.
Monday, March 6, 2017
Baluns -- Under the Hood
Below are views of 3 baluns that I own, with their covers removed to see the internals. The first photo shows 2 LDG baluns that are rated for 200 W. The one on the left is a 1:1 current or choke-type balun. The one on the right is a 4:1 balun that appears to be a voltage-type balun. For some in-depth discussion of balun types, see this article by W7EL.
Above are schematics of the two LDG baluns, using graphics from the W7EL article.
The next 4 photos show the internals of a DX Engineering balun DXE-BAL050-H10-AT that is rated for 5 kW CW and 10 kW SSB.
- John
![]() |
| LDG baluns |
|
|
Above are schematics of the two LDG baluns, using graphics from the W7EL article.
- John
Comparing 3 Feed Line Lengths
I added another 3 ft of 450-ohm ladder line to my antenna feed line, bringing the total length of ladder line to about 99 ft. Using data measured by my antenna analyzer, I compared the current data with what I collected with the previous lengths of 91 and 96 ft. Below are graphs that compare the SWR and impedance (magnitude) for the 80 m and 40 m bands.
Click on any graph to view it full size. These graphs show the effects of lengthening the ladder line feed while keeping the antenna length constant at 102 ft end-to-end.
![]() |
| SWR 80 m |
![]() |
| SWR 40 m |
![]() |
| |Z| 80 m |
![]() |
| |Z| 40 m |
Click on any graph to view it full size. These graphs show the effects of lengthening the ladder line feed while keeping the antenna length constant at 102 ft end-to-end.
Sunday, March 5, 2017
Bringing Gamma Back -- Alzheimer's Research
A December 2016 NPR Radiolab podcast reported on research using mice that discovered
the beneficial effects of blue light flashing at the brain's gamma wave
frequency, reversing Alzheimer's effects, at least temporarily. The
audio program runs for almost 25 minutes and has a few promotional
announcements (commercials).
Below the web page graphic are some recommended links for additional information.
YouTube provided this related link. It shows an 83-year old man who claims to have recovered from severe Alzheimer's symptoms with a certain daily medication combined with a few supplements and dietary elements associated with populations that do not develop Alzheimer's disease.
Friday, March 3, 2017
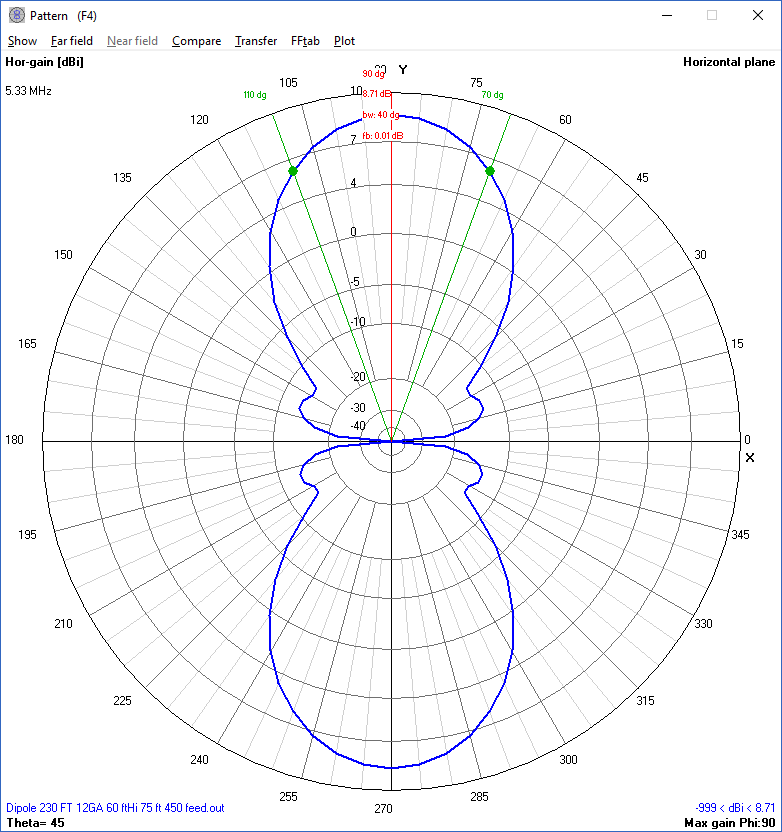
230 ft Multi-band Dipole
This posting provides a collection of antenna model graphs for a multi-band dipole with the following specs:
Model results are provided for the following bands: 160, 80, 60 and 40 m. For each band the graphs are:
- 230 ft end-to-end horizontal
- 60 ft above ground
- 75 ft of 450-ohm balanced feeder
Model results are provided for the following bands: 160, 80, 60 and 40 m. For each band the graphs are:
- SWR at the transmitter end of the feed line
- Impedance data (R, X, |Z|, phase) at the transmitter end of the feed line
- Vertically polarized radiation pattern in the vertical plane
- Horizontally polarized radiation pattern in the horizontal plane
|
|
||||
|
|
||||
|
|
||||
|
|
||||
|
|
||||
|
|
||||
|
|
||||
|
|
Friday, February 24, 2017
Multi-band Dipole -- ladder line 96 ft vs 91 ft
Following another suggestion for tweaking my dipole, I added 5 ft to the 91 ft 450-ohm ladder line and used my antenna analyzer to compare the results with what I obtained previously. The two graphs below compare what the auto-tuner was able to achieve on selected frequencies on the 80 m and 40 m bands. SWR readings are what my transceiver reported after the tuner had reached its best match. Click on each image for the full size view.
The 40 m band view shows mixed results, but all readings are below SWR = 2.0.
The next two graphs compare the impedance magnitude vs frequency for the same two feed line cases on the 80 m and 40 m bands.
The 80 m band view shows that the impedance curve is shifted lower in frequency for the longer feed line.
The 40 m band view shows lower impedance at each frequency for the longer feed line.
I'm reviewing the SWR data measured by the analyzer for these same cases. The numbers become erratic at SWR above 10. Below is the graph for the 80 m band. For the 40 m band, all data points are above SWR = 38 and are erratic. These values are probably beyond the valid range for the analyzer hardware.
The 80 m band view shows that the longer ladder line feed results in lower SWR on the frequencies below 3.9 MHz.
The 40 m band view shows mixed results, but all readings are below SWR = 2.0.
The next two graphs compare the impedance magnitude vs frequency for the same two feed line cases on the 80 m and 40 m bands.
The 80 m band view shows that the impedance curve is shifted lower in frequency for the longer feed line.
The 40 m band view shows lower impedance at each frequency for the longer feed line.
I'm reviewing the SWR data measured by the analyzer for these same cases. The numbers become erratic at SWR above 10. Below is the graph for the 80 m band. For the 40 m band, all data points are above SWR = 38 and are erratic. These values are probably beyond the valid range for the analyzer hardware.
Sunday, February 19, 2017
Multi-band Dipole - version 2
This posting continues my exploration of the performance of my multi-band dipole as reported earlier. Based on suggestions from KE4ID, I revised my antenna to the following specs:
The graph below shows the SWR vs frequency as measured with my antenna analyzer across the range of 3 to 30 MHz. The wide variation of SWR is an indication of the complexity of the overall antenna system. Also shown (as discrete points) are SWR data for selected frequencies on the transceiver side of the antenna tuner. These points show that the tuner is able to present reasonable SWR to the transceiver on most of the frequencies I sampled. An area of challenge is the 3.5 to 4 MHz band. The next graph shows this frequency range more closely.
The graph below shows the frequency range of 3.5 to 4 MHz. Along with the same SWR data measured by the analyzer there are two sets of SWR points from the transceiver side of the antenna tuner. Testing with the LDG 1:1 balun provided better results than the DX Engineering 1:1 balun at the lower end of the frequency band. Similar high SWR results at the low end of the band were also obtained with the previous configuration of the antenna and feed line.
The power efficiency of this antenna system (as built) is unknown. Instrumentation on the antenna side of the balun might reveal how much power or current is outbound to the antenna, and how this design compares with resonant antenna designs.
While adjusting the overall length of the antenna from 110 ft to 102 ft, I had the opportunity to notice lightning-caused damage from last summer's event reported here. The two photos below show the effects at the western end of the antenna. Click on each image for the full size view.
- 102 ft total length of horizontal portion (previously 110 ft)
- 91 ft of 450-ohm ladder line (previously 84 ft)
- DX Engineering 1:1 balun (also tested with LDG 1:1 balun on 80 m band)
- 12 ft of 50-ohm coax to the antenna tuner
The graph below shows the SWR vs frequency as measured with my antenna analyzer across the range of 3 to 30 MHz. The wide variation of SWR is an indication of the complexity of the overall antenna system. Also shown (as discrete points) are SWR data for selected frequencies on the transceiver side of the antenna tuner. These points show that the tuner is able to present reasonable SWR to the transceiver on most of the frequencies I sampled. An area of challenge is the 3.5 to 4 MHz band. The next graph shows this frequency range more closely.
![]() |
| SWR - 3 to 30 MHz |
![]() |
| SWR - 3.5 to 4 MHz |
While adjusting the overall length of the antenna from 110 ft to 102 ft, I had the opportunity to notice lightning-caused damage from last summer's event reported here. The two photos below show the effects at the western end of the antenna. Click on each image for the full size view.
Subscribe to:
Posts (Atom)